Reduce Data Analysis Time: Exception Reporting for Exceptional Professional Services Firms
In the professional services industry, reporting is key. The common complaint amongst professionals is they don’t have time to analyze the data, since they need to just get the job done. Time is always of the essence, but true efficiency incorporates being proactive and taking the time to evaluate the data and determine what to pay attention to or worry about. This is where exception reporting comes into play.
Many times, though, professionals aren’t really aware of the robust capabilities of exception reporting and how it can save firm leaders and employees valuable time. Oddly, there seems to be some disconnect about the real benefits of exception reporting to their firm’s bottom line.

What is Exception Reporting?
Simply put, exception reporting can indicate a red flag to a business. Within the professional services industry, it is especially important to receive exception reporting related to projects and people. An exception report can be a report, alert and/or dashpart that notifies a user, department, or business about data that is outside of a defined expectation of what is typically acceptable. This notification indicates action should be taken. With an ERP or business intelligence system, exception reporting can be programmed to highlight parameters of values that appear outside of a defined criteria range.
Why Use Exception Reporting?
With growing professional services firms, the more projects a firm wins, and the more employees hired, means managing more projects and employees. Anyone in the professional services industry knows that there is no such thing as a perfect project. Whether managing projects or employees, it’s important to know what needs closer attention and when to adjust a project or processes. With the ebb and flow of projects and availability of resources, those adjustments can come at any time. When done right, exception reporting can ensure a firm is addressing potential problems or weaknesses before they wreak havoc on the bottom line.
What Are Examples of Exception Reporting for Professional Services Firms?
Exception reporting can be simple or more in-depth for professional services firms. Below are some examples of the most commonly used exception reports along with some that are less common, but highly effective within the professional services industry.
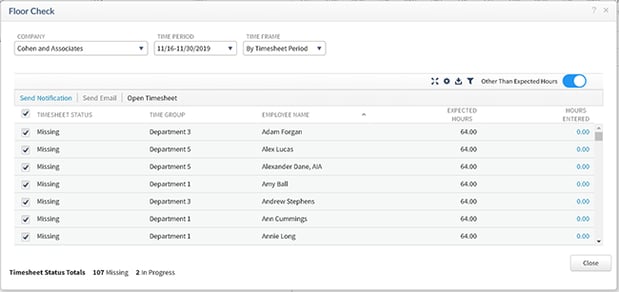
Identify Unsubmitted Timesheets with Ease
Having timesheets completed on time allows for timely billing and improved cash flow. Additionally, having the ability to list the staff who have worked less than expected hours for a selected time period lets managers know who to focus their efforts on and helps avoid mass emails to the entire company. Below is an example within Deltek Vantagepoint. Managers can identify which of their employees need to receive notifications or reminders and can quickly send one. Accounting and principals will also find it helpful to know which managers are underperforming. Additionally, business intelligence tools, like Entrinsik Informer, can provide insight in a visual way to alert those department managers who have the most employees slacking on their timesheet.
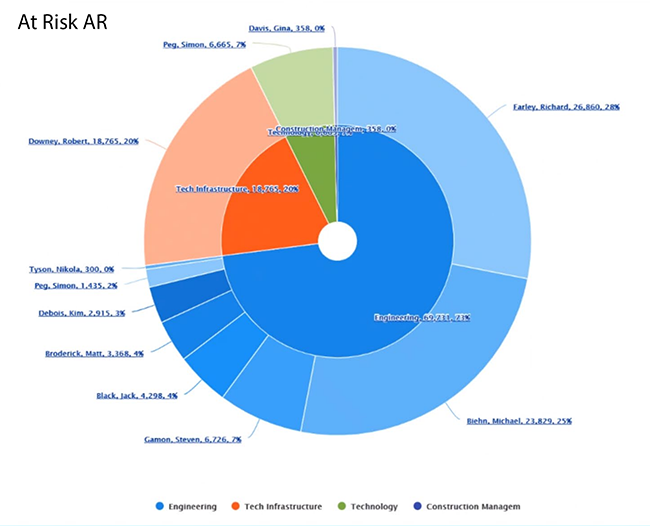
Draw Attention to Accounts Receivable (AR) at Risk
Accounts receivable “at risk” refers to the likelihood that a client or project is beyond the expected timeframe. For some firms, this may be 45 days and others may deem more than 60 days as being unacceptable. The longer the DSO (days sales outstanding) cycle, the more likely a business is offering credit to its clients. The longer the bill goes unpaid, the more likely a firm may not collect 100 percent of what is owed. Providing accounting, project managers and principals a list of “at risk” accounts allows a firm to focus just on those that are beyond the normal threshold.
A project manager might be managing 50 projects. With an exception report, the PM can quickly see that they have 10 projects that need attention related to AR. For accounting and principals, an exception report may be one showing which project managers, principals or divisions have the most AR “at risk” to narrow down individuals or groups that need further attention.
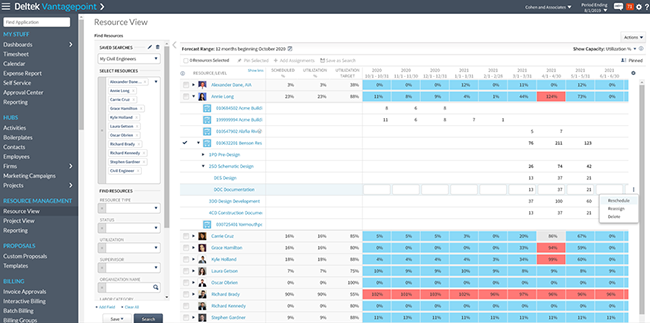
Resource Allocation Balancing
Another example of an exception report is one providing management information to demand the resources they need. With a resource allocation report for a project-based business, it outlines competing priorities required to execute on projects. It provides those overseeing projects the ability to determine who is over and underutilized allowing them to readjust those out of balance to maximize the effectiveness of the firm’s resources.
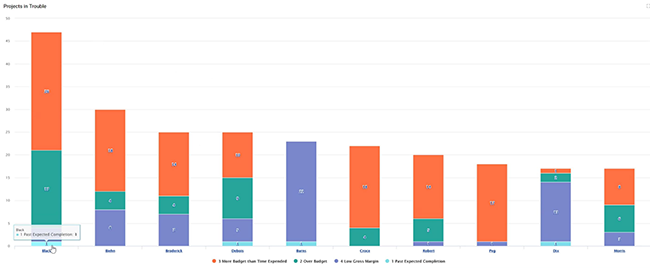
 Spotting Projects in Trouble
A projects in trouble report is another exception report that identifies variances from the plan or project data. This type of report identifies the reason(s) a project may potentially be in trouble. The Blackbox Connector for Entrinsik Informer has an out-of-the-box BI reporting solution that can report on common reasons a project may be in trouble and includes:
-
Over budget or approaching budget
-
Low gross margin ratio percentage
-
AR is at risk or getting old
-
Percentage of time used is beyond expected days
-
Actual hours exceed budget
-
Low expected revenue
-
Project past expected completion date
-
No current activity
 Project Feedback to Manage Expectations
Listening to feedback from clients about a project is essential to ensure project success. Projects require adjustments along the way and the best way to ensure a project is meeting client expectations is to provide a method for clients to provide quick feedback. The most effective method for professional services firms we have seen is the Client Feedback Tool by Client Savvy. This electronic feedback is quick, effective, and provides indicators when someone records a low score. As a result, an exception report alerts the team and leaders that follow-up is required, and potential mentoring of their employees is needed.
 Reduce Employee Turnover with a Burnout Report
In professional services firms, a commonly used phrase is “our employees are our greatest asset.” This is true for so many reasons as they are often the primary contact with our clients. They also have the project knowledge as well as the technical skills required for project success. Having to replace an employee on a project costs time and money and can potentially result in a poor product or project delays. Ensuring that employees are maintaining a work life balance goes a long way to keeping productive staff. Providing executives and managers an exception report on identifying employees that may potentially be burnt out can help reduce turnover. In a burnout report, criteria might include employees that have:
-
Not taken PTO in the past 6 months
-
No PTO scheduled for the next 6 months
-
Consistently working more than 8 hours a day
 Being Proactive with Exception Reporting Adds to Bottom Line
Training project managers, principals and teams on project details to look for across the board is essential. Exception reporting is a great way to quickly identify variances between what is expected and what is happening to help identify potential issues sooner. Utilizing business intelligence like exception reports offers firms the chance to proactively make adjustments and reduce data analysis time. Exception reporting can be a positive thing to help achieve better processes or avoid costly issues and should be a part of professional services firms’ operational strategies.


 Business analytics has become increasingly important for professional services firms. However, finding a business intelligence (BI) tool that works with Deltek Vision and gives us the analytics we want has been challenging. We need flexibility, customization and ease of use to answer important questions about our firms yet often we find that this type of analysis is not accessible in Vision. Thus, we are faced with the export/import/number crunch process in an external tool like Excel plus countless hours spent doing the calculations over and over. We need a better solution, instant access, and easy updates.