Full Sail Partners Blog | Resource Management

Posts about Resource Management:

The How-To Guide for Understanding Capacity Calculations in Deltek Vantagepoint Resource Management

Posted by Terri Agnew, CPA on September 28, 2023

9-28-23_ResourceMgmt Views - Banner

Using the Resource View in Deltek Vantagepoint is a quick and easy tool for project-based firms to determine which employees are properly scheduled or utilized, and/or those who may not have enough or too many hours planned. This view has a lot of valuable information on one screen and can sometimes seem a bit overwhelming. So, the content provided here in this blog, which is utilized with Resource Planning licensing, will assist you with the questions like “What do the blue/red/grey colors mean?” or “How is the utilization % calculated” and help make this form one of the most important tools in your firm’s resource management toolbox.  

Three Show Capacity Views 

There are three different options to monitor your resources: Planned Hours, Scheduled %, and Utilization %. Below you will find illustrations showing how these three views are calculated for you to better understand the information Resource View is displaying. 

Planned Hours 

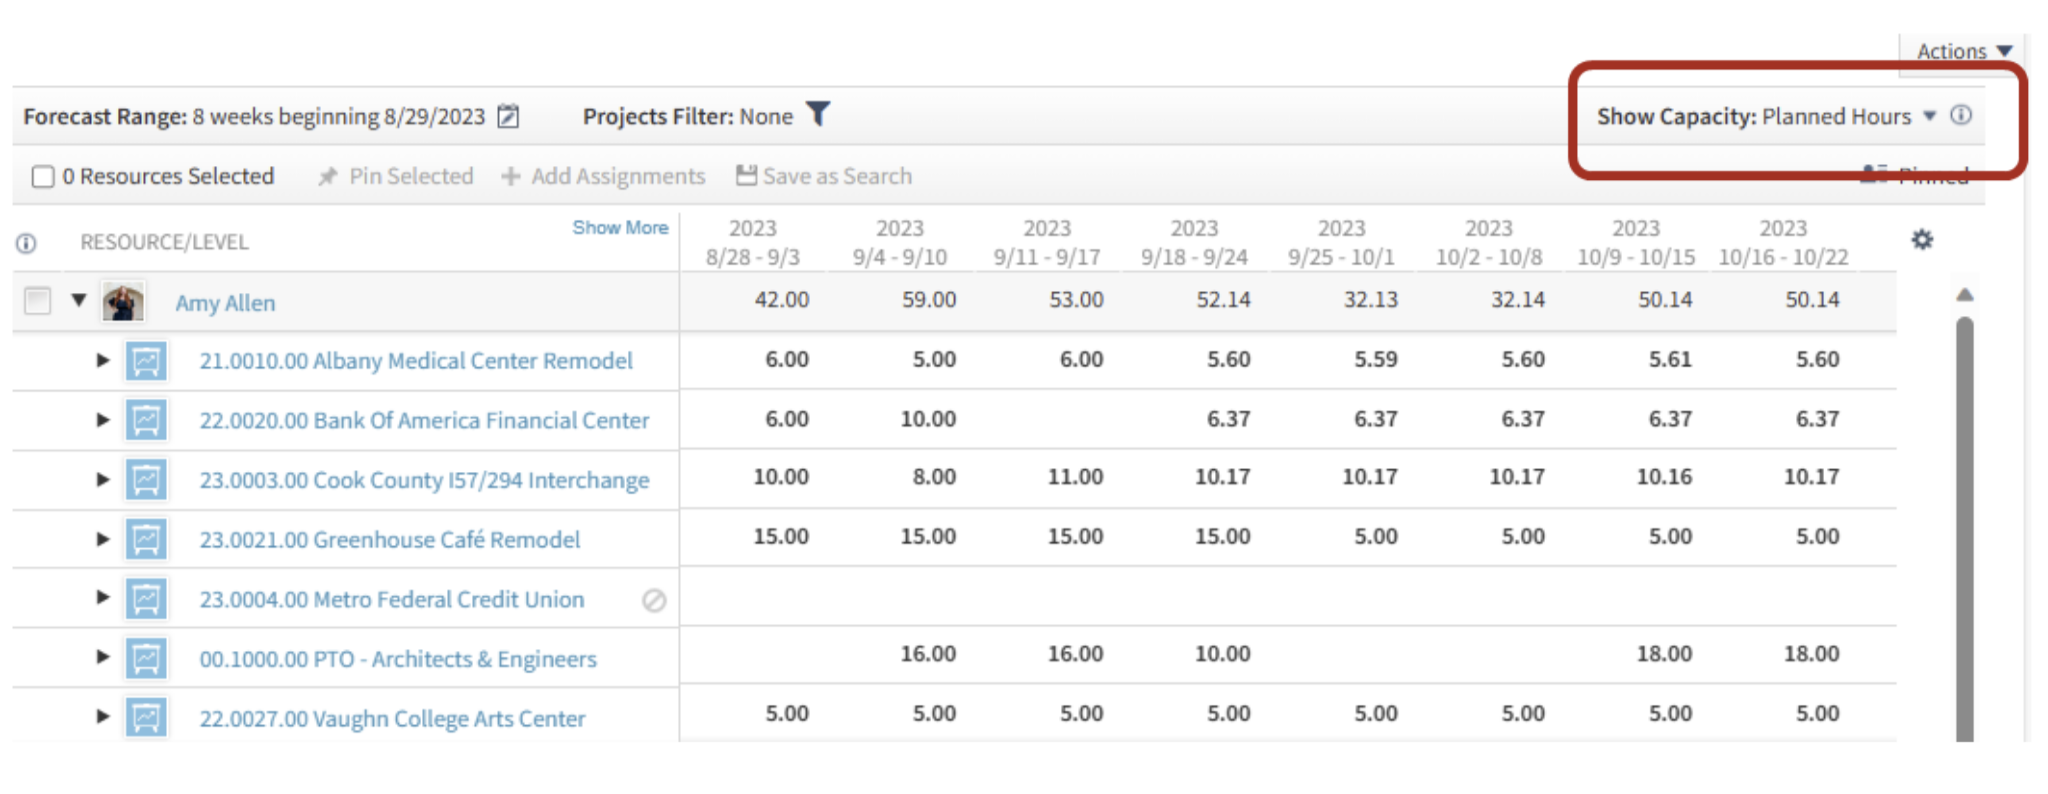
Planned Hours is the simplest of the calculations as it is what it says it is – all planned hours! Use this view to simply check each selected resource's total planned hours for the time period shown in the Forecast Range. Planned hours will be shown for all published plans for ALL types of projects – overhead, promotional, and regular projects. Planned hours will show even if the project is showing a capacity calculation of excluded from scheduled and utilized % on the project’s summary pane. 

ResourceMgmt_01

Scheduled %

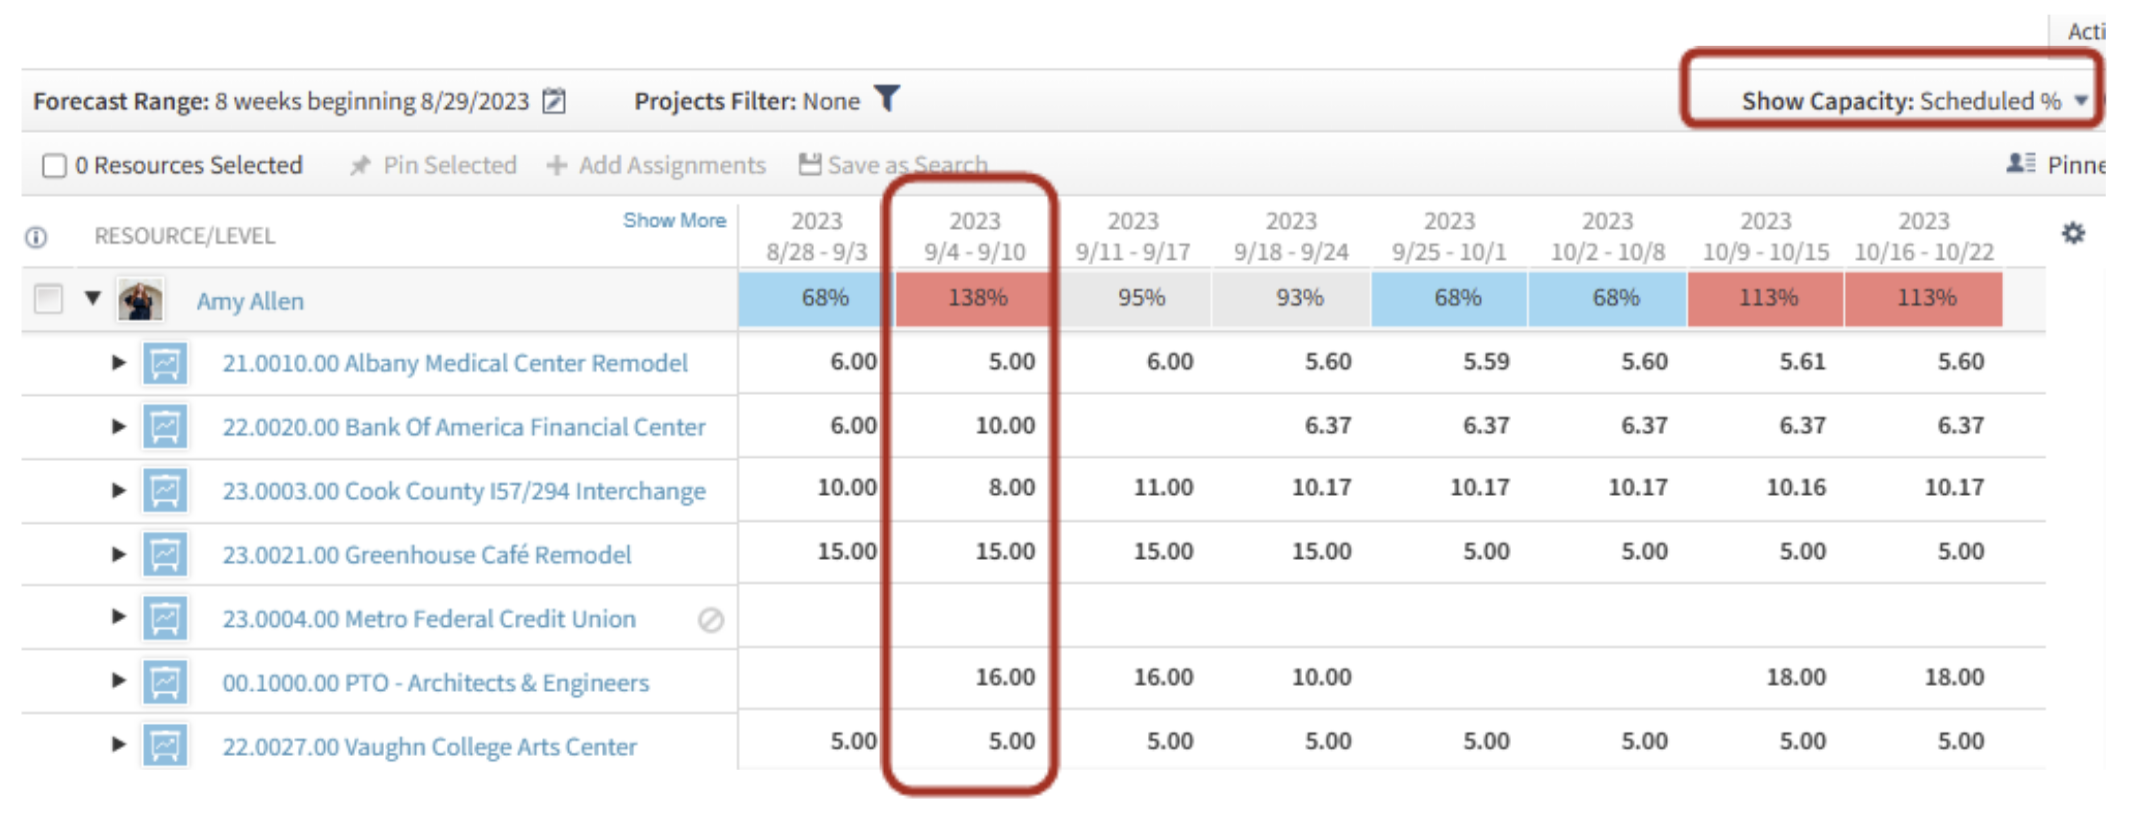
When you change the view from Planned Hours to Scheduled %, you will notice the “heat map” will appear. This “heat map” is used to visually draw a user’s attention to which resources are properly scheduled (grey), under scheduled (blue), or over scheduled (red) based on the firm’s chosen thresholds (Settings > Resource Planning > Resource Settings). 

ResourceMgmt_02

The Scheduled % is a calculation of Planned Hours divided by Available Hours for the resource. This view is great to use to get an understanding of if a resource is too busy (red) or has availability to be assigned to more projects (blue) or if they are appropriately scheduled during the timeframe (grey). 

  • Planned Hours - this calculation will include all types of projects (regular, promotional, & overhead). However, if a project shows as “Excluded from Scheduled and Utilization” on the Project’s Summary tab, those planned hours will not be used in this calculation. Note that excluded hours will still show the hours when the details are expanded for the resource. 
  • Available Hours - these are calculated using the employee’s standard hours from their employee hub, less any non-workdays as indicated in Settings > Resource Planning > non-Workdays. 

In the example shown below, I will break down the calculation for the week of 9/4 – 9/10 where Amy Allen is showing over scheduled at 138%. 

Planned Hours / Available Hours = Scheduled %      =     44 / 32 = 138% 

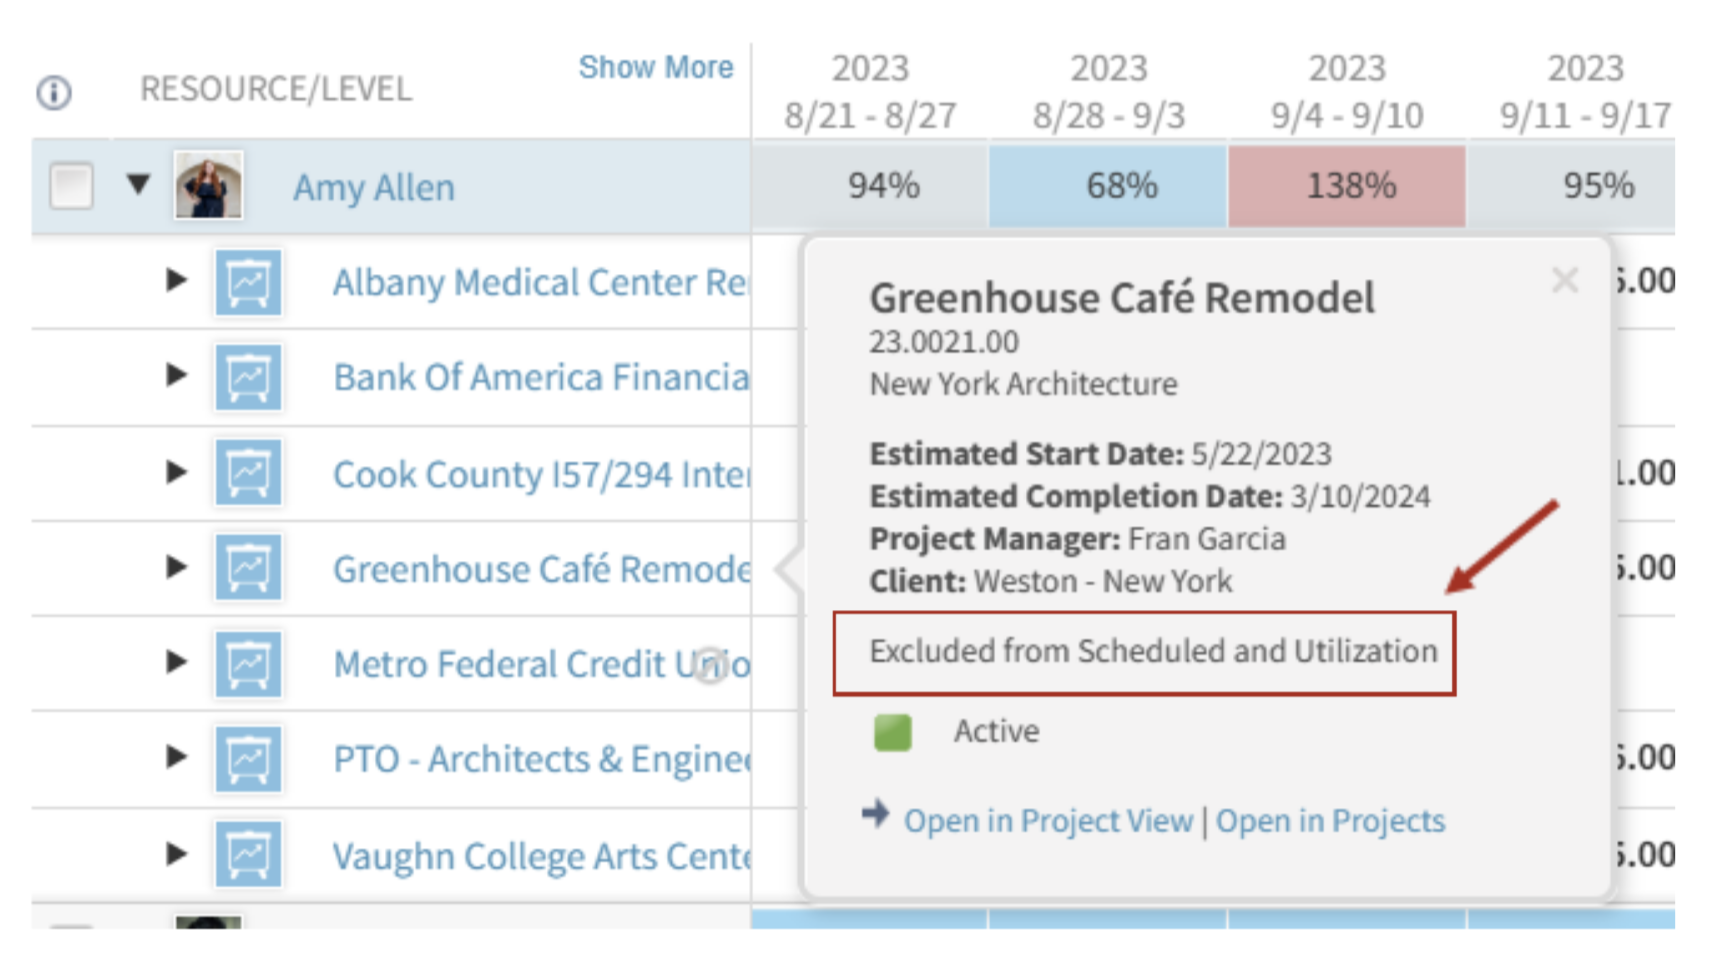
Planned Hours = 59 total hours planned less 15 hours for Greenhouse Café Remodel as that project is currently set to “Exclude from Scheduled and Utilization” in the project. The numerator is 59 -15 = 44 hours. 

*Note when you click on the blue link of each project, a small summary box for the project will appear where you can easily see if a project is “included” or “excluded” from Scheduled and Utilization. 

ResourceMgmt_03

Available Hours – Amy Allen’s standard hours are set as 8 hours per day in her employee hub, which is typical for a full-time 40-hour/week employee. The week of 9/4 – 9/10 contains a Labor Day Holiday in the company’s non-workday settings. As discussed earlier, holiday hours are excluded from available hours. Therefore, the denominator is 40 – 8 = 32.  

 *Note that when you click on a resource’s name, the Employee Card will appear. On that employee card, you will find the Hours/Day in the bottom right of the Profile Tab. 

Now, the shading!  What is this heat map telling you?   

Understandably, being scheduled at 138% would seem to be over scheduled just because it is a relatively large number, but the system is compared to the firm’s Resource Planning Settings. In my demo database shown here, the blue shading indicates under scheduled as under 90%, and the red shading for over schedule when over 105%. Grey is “just right” of 90 – 105%, which this firm has indicated as appropriately scheduled.    

In summary, in my database, a full-time, 40-hour/week employee would show as properly scheduled (grey) if the scheduled hours are between 36 (90% x 40) and 42 hours, under-scheduled would be less than 36 hours (blue) and over scheduled as over 42 hours (red). 

Utilization %

The Utilization % will show the percentage of the planned hours for billable projects (regular/won projects) and those In Pursuit projects marked as “included in scheduled and utilization”. Use this view to show how an employee is tracking against their Target Utilization. Even if an employee is well scheduled, in the example above, if several of the projects are either overhead or In Pursuit and not included in scheduled and utilization, the employee may be shown as under-utilized.  

ResourceMgmt_04

Utilization % is a calculation of Total Billable Planned Hours divided by Available Hours (same calculation as above). 

Total Billable Planned Hours only includes regular projects, no promotional projects nor overhead projects. Regular projects will be all those in the Stage Step of Won and any In Pursuit that are “Included in Scheduled & Utilization” Capacity calculations. 

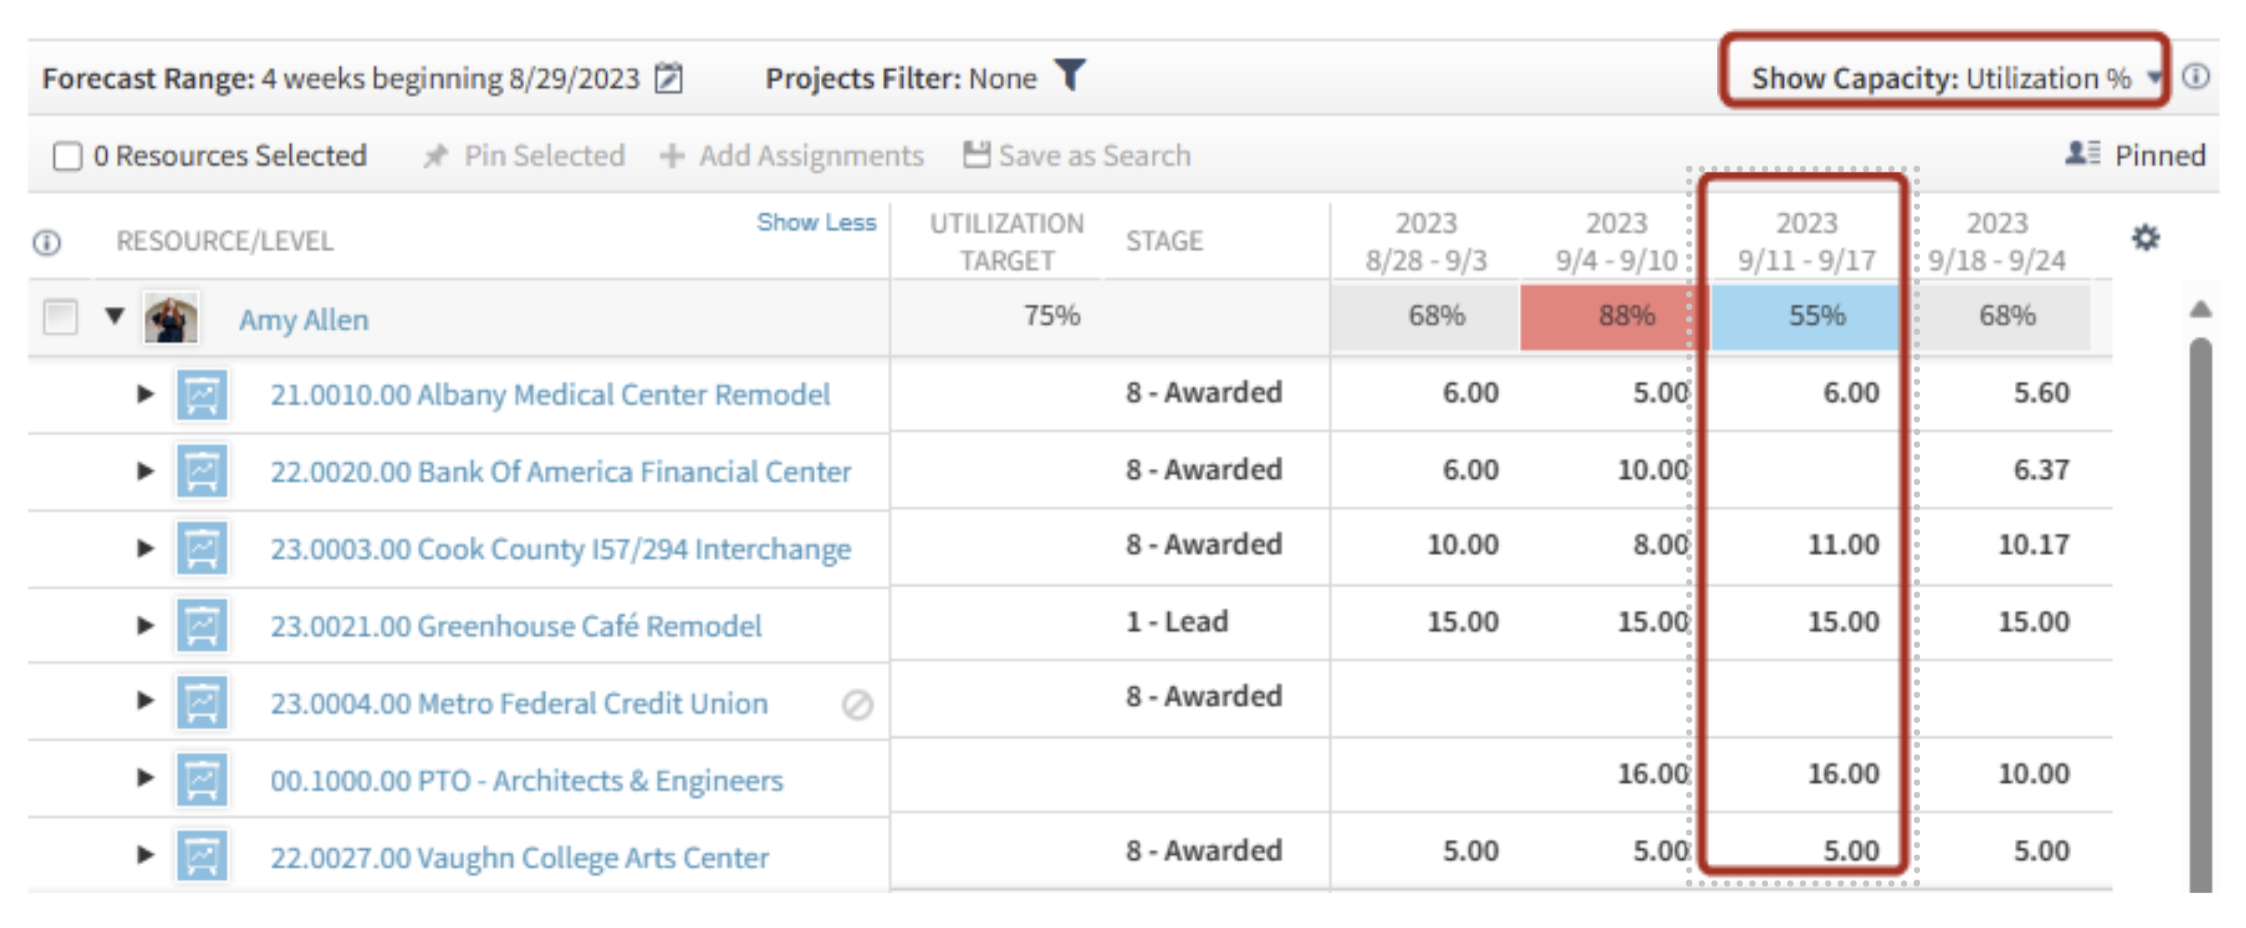
For this example, I will be showing the calculation for the week of 9/11 – 9/17 from the picture above. In this view, I am also showing a few additional columns in the middle grid that help demonstrate if a project is “billable” or not.   

As you can see, I have one project that is a Lead Stage – Greenhouse Café Remodel, and as discussed above, that project is Excluded from Scheduled and Utilization so those hours will not be included in the numerator. Additionally, there is one project that is overhead (no stage listed), which is PTO.   

Total Billable Planned Hours / Available Hours = Utilization %      =     22 / 40 = 55% 

Total Billable Planned Hours = 53 total hours planned less 15 hours for Greenhouse Café Remodel as that project is currently set to “Exclude from Scheduled and Utilization” in the project, less the PTO hours of 16. The numerator is 53 -31 = 22 hours. 

Available Hours (as stated above) are calculated using the employee’s standard hours from the employee hub, less any non-workdays. This week does not have a holiday and this employee’s standard hours are 8 hours/day so the Available Hours = 40. 

Shading for Utilization %: 

To understand the heat map for the Utilization %, the formula considers each employee’s Utilization Target, which is set in the Employee Hub. This employee, Amy Allen, has a Utilization Target of 75%. 

The threshold calculation is the Utilization % divided by the employee’s Utilization Target. 

For the week ending 9/17, Amy’s planned Utilization % is 55% divided by the target of 75% equals 73%. In my demo database shown here, the blue shading will be under-utilized if the utilization % is under 90%, red shading over 105%, and “just right” or grey is between 90 – 105%. Therefore, since Amy’s threshold calculation is 73%, she is showing blue as that is under-utilized in my database. 

Capacity Calculations Made Easy with Resource View 

So, in summary, the Resource View in Deltek Vantagepoint has a lot of valuable information on one screen. You can use it to navigate to three different views to understand (1) how many hours an employee has planned in total (Planned Hours), (2) if the employee is over/under scheduled (Scheduled %), and (3) if the employee is over/under utilized by simply navigating between the three options in “Show Capacity”. Project based firms should be making the most of the resource management tools available within Deltek Vantagepoint! To learn more about this feature and other Resource Management tools, please visit our webinars located here: Webinars for Project Manager Rockstars! 


 New call-to-action

10 Most Common Resource Management Problems

Posted by Rana Blair on May 18, 2023

05-18-23 10 Most Common Mistakes Resource Management_Banner rev

Hey there, professional services firms! We need to talk about something important. No, it's not about who has the best coffee in the office (although that's important too). We need to address the top ten resource management problems that could make or break your success. Don't worry, I'm here to give you the low-down.  

Problem #1: Missed Project Deliverables and Deadlines 

Picture this: a client is eagerly waiting for their project to be completed, but the deadline passes, and there's no sight of the deliverables. Chaos ensues as the client starts breathing down your neck, and you realize you don't have sound processes in place. Good luck getting out of that one! 

Getting the work done on time sounds simple, but it’s not. It’s a complex balancing act involving creativity, quality control, resource management, and much more. If you don’t have sound processes in place, all the best thinking in the world won’t mean a thing. 

Problem #2: Ineffective Documentation on Billable Hours 

So, you've been working tirelessly on a project, but when it's time to bill the client, you realize you don't have accurate documentation of the billable hours. Cue the client disputing your bill and leaving you with an empty wallet.  

What creative person wants to hear that their success might rely in part on basic accounting skills? For professional services firms, effectively managing billable hours is one of the biggest factors in profitability, and thus, lasting success. Need help with billing effectively? Watch our mini demo now! 

Problem #3: Lack of Project Resource Visibility 

Now, let's talk about visibility. Your firm’s management needs to quickly understand which projects are underway for which clients. This means having visibility of progress on milestones, technical issues, and how, when, and where resources have been allocated. It's time to get your head out of the clouds and start paying attention to the details. 

Problem #4: Assigning the Wrong People to Teams 

You've got a project that requires specialized knowledge, but instead of assigning the right people to the team, you just throw some random folks in there. The project turns into a hot mess, and the client is none too pleased. Looks like you just lost a customer, honey! 

Each project requires a team with the right insights, talents, and other qualities. Assigning the wrong people to a project can have a negative impact on profitability and success. So, let's stop playing musical chairs and put the right people in the right seats! 

Problem #5: Accounting and Project Management Disconnect 

Let's address the accounting and project management disconnect. Using multiple tracking systems for financial and project data can lead to errors and make it difficult to respond to issues. Consolidate your tracking systems, and make it rain with those profits. 

Problem #6: Inefficient Cash Forecasting 

You've got a project that requires a lot of resources, and you're not sure how much cash you'll need. You don't allocate resources to a timeline, and now you're in a cash flow crisis. Better start penny-pinching, sugar! 

Cash forecasting can be a complicated process, but it's essential for successful resource management. Allocate resources to a timeline for efficient cash forecasting. Your wallet will thank you later. 

Problem #7: One-off Spreadsheets and Workarounds 

Spreadsheets and workarounds are so 2005. Silos across a firm can lead to duplicated efforts, incomplete solutions, missed opportunities, and unprofitable projects.  

Picture this: you've got a project that requires a lot of data, and you decide to use a spreadsheet to keep track of everything. But then, someone else on the team creates their own spreadsheet to keep track of something else, and before you know it, there are spreadsheets and workarounds all over the place. 

Now, you've got a mess on your hands. Data is duplicated, incomplete solutions are everywhere, and you're constantly missing opportunities. You're wasting valuable time on duplicated efforts, and you're not making the profits you should be. 

So, what's the solution? It's simple, really. You need to get everyone on the same page. You need a centralized system that everyone can use to track data, projects, and resources. No more one-off spreadsheets or workarounds - it's time to get serious about your business. Read our article on The Best BI Tool for Deltek Vantagepoint Users and find out what application is right for you! 

Problem #8: Under-Informed Decision-Making 

It's all about the information, baby. Resource management problems involve information regarding projects, teams, or human and other resources. Management must have a large dataset at their fingertips before making big decisions. Failing to do so can result in under-informed decision-making, and ain't nobody got time for that. 

Problem #9: Failure to Meet Financial Reporting Standards 

We're getting close to the end, but we can't forget about compliance. Professional services firms often need to comply with various reporting regulations such as Earned Value Management (EVM). So, let's make sure we're crossing our T's and dotting our I's, and getting paid for our hard work. 

Problem #10: Missed Business Opportunities 

You've got a business development team that's not managed effectively, and you're missing out on potential opportunities. Your ROI and profitability suffer, and you're left wondering why you're not making any money. Time to start taking business development seriously, sweetie! 

Organizing and managing the work of business development teams is complex and high-stakes. Effective management can optimize ROI and profitability and ensure just-in-time hiring or business development. Let's do this! 

In conclusion, don't let these resource management problems drag you down. Get your head in the game and address these issues head-on. Whether you manage them in-house using ERP software and other solutions or outsource them all together, make sure to handle them properly. And remember, nothing screams success like a firm that's got its resource management problems in check! 


New call-to-action

Latest Posts