Full Sail Partners Blog
 For firms in the project-driven Professional Services industry, managing a defined set of tactical project management metrics is key to meeting strategic objectives.
Although it might seem efficient to have a single indicator of project success that measures the firm’s profit growth — for example, project profitability — there are pitfalls with such an approach. A better solution is to measure across a finite and efficient set of indicators that together track whether the firm is meeting its objectives, whether the specific goal relates to market penetration, service offering penetration or key account growth.
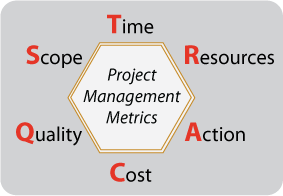
Project Management Metrics — collectively known as the Project Management KPI — fall into six major categories. One way to remember these categories is to use the acronym TRACQS.
Is your project on TRACQS?
Time - How is the project tracking against schedule plans?
Keeping projects on schedule increases profit growth by lowering overhead and increasing labor margins. For example, when a project is off schedule and staff is reallocated it increases overhead to readjust the schedule may reduce realized utilization.
Metric calculation: Schedule Performance Index (SPI) = Earned Value of the work performed ÷ Planned Value of the work performed (to date).
Resources – Are we within anticipated limits of staff-hours spent?
Using staff and labor multipliers as budgeted is essential to maintaining project margins. When evaluating which resources to use, it is sometimes argued to use a more skilled person that will use fewer hours than a less experienced person. The thought is the margin will ended up the same. However, when this decision is made business development and client relations to do the production work can result in the firm’s backlog and pipeline suffering.
Metric calculation: Total Hours variance for budget vs. spent AND Labor Multiplier
Budgeted versus Labor Multiplier Attained.
Actions – Do we have action items outstanding or past due?
It may seem obvious, but without a metric tracking action items (completed, missed, and planned), project performance cannot be corrected. Maintaining visibility and monitoring deliverables can increase client satisfaction and reduce inefficient cycles of “catching the project up”.
Metric calculation: Number of project collaboration tasks that are past due.
Cost – How are we doing against the budget?
Monitoring this project performance metric provides direct insight into a firm’s profit growth.
Metric calculation: Cost Performance Index (CPI) = Budgeted Cost of the work performed ÷ Actual Cost of the work performed.
Quality – Does client feedback indicate project success, or the need for correction?
On a regular basis, survey clients about results and milestones, based on meeting the client’s expectations to the deliverables. There is little to no change that can affect the project, if you wait until the end of the project to conduct a survey, there is little to no change that can affect the project. A satisfied client results in more work (client retention), reference-ability (more clients) which are essential to firm growth.
Metric calculation: A rating greater than X means quality, and anything less requires attention.
Scope – Is the scope staying within budget? If not, do we have authorization for variances
of planned from baseline?
Clearly define an agreed upon scope, the client’s role or responsibilities, and qualifying what constitutes a change in scope is an essential first step. When the scope has changed, documenting “why” will allow for margins to remain intact for
client requested change orders and allow management to take corrective action when the scope creep is due to the firm’s lack of performance to the initial scope.
Metric calculation: Comparing where planned exceeds baseline, and ensuring that original scope plus authorizations equal or exceed the estimate at completion.
Clearly, a firm needs to have mechanisms in place to measure these project management metrics. Almost as important, however, is finding a way to indicate variance from expected (budgeted) results in an easy-to-reference graphical format — e.g., blue for good, red for bad. Doing so will ensure that staff, project managers, and executives are all on the same page for tracking firm growth and responding to any obstacles or problems that may appear.