
Full Sail Partners Blog
Seeing is believing, and with Entrinsik Informer, many different types of professional services firms already have the ability to quickly visualize and analyze data to make informed business decisions. Informer, a highly ranked business intelligence (BI) solution, allows users firmwide to create customized dashboards and easily drill down into the data pertaining to their specific department and role to find the answers to questions or get status reports on areas of concern.

So much insight can be gained already using Informer. However, with the latest release of Entrinsik Informer 5.4, employees at professional services firms now have new and improved features to improve data visualization.
Enhancements with Informer Template Creation
Templates are an exciting new feature in Informer 5.4. Templates are custom formatted outputs using HTML coding. This allows total pixel-perfect control over the end product. The template code is in HTML, but being an HTML expert is not required. Many users of the Informer business intelligence tool have little or no HTML experience when they first start. Some even creating a template in less than a day.
Using the data that resides in a firm’s Deltek Vision or Vantagepoint system, firm employees are able to customize the final output into almost any format. The first step is to get the data organized into datasets so that it is easily available for the template. Then it is simply creating the template in the format the user wants.
Within the template, logical formulas can be applied. For example, if the invoice on an accounts receivable (AR) statement is past due, it can be shown in yellow highlight, or if survey is checked in an opportunity, specific survey language can be inserted into the agreement that is being sent to the client.
Additionally, users will be able to create a CSS (Cascading Styles Sheet) for templates to standardize the firm’s output and have logos readily available. Even more, there is also a way to save those commonly used expressions, so it is not necessary to retype every time.
Some of the uses for the templated output are:
- Client Agreements
- Compensation Reports
- Financial Reports
- Project Status for Clients
- AR Statements
- Custom Invoices
- Governmental Reporting (DOT reports)
Once a templated output is set up, it is repeatable and can be shared firm-wide with the appropriate staff.
New Ways to Look at Data
Informer 5.4 also offers different ways to visualize data. Within the Informer 5.4 visuals tab, new visualization charts are available, heat maps and spider charts, which allow fresh perspectives to analyze important data.
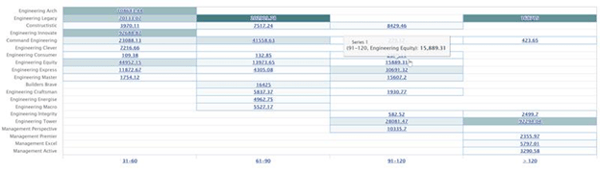
A heat map is a graphical representation of data where values are guided by color accent with the deeper the shade, the higher the value. Heat maps are a great way to see concentrations in the data and are really useful if there is a lot of data to manage. In this example, at first glance, the color variations easily indicate the different values and can guide evaluation.
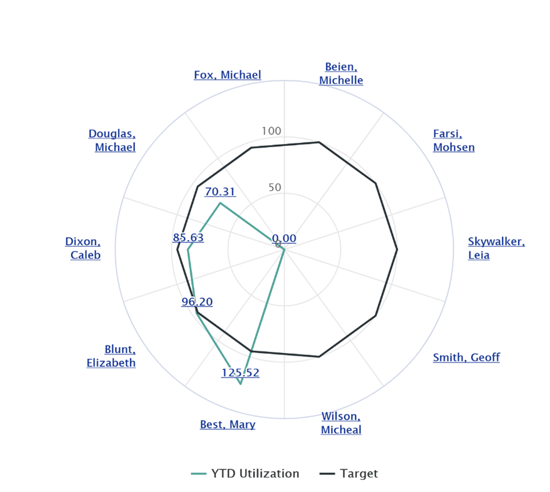
A spider chart, by comparison, is a helpful way of showing outliers. For example, a spider chart may show employees with the highest or lowest utilization. By viewing the chart, it is apparent that Mary Best is exceeding her utilization target, while Michelle Beien, Moshen Farsi, Leia Skywalker and Geoff Smith are not.
See More than Before with Informer 5.4
The Entrinsik Informer 5.4 release was developed to improve how users can take their BI further and visualize their data so that better and quicker decisions can be made. With this newest release, users of Informer across the firm will have even better options for visualizing their data. And, going into the future, as BI needs continue to evolve so will Entrinsik Informer to meet them.
